Going further in our Google Maps inquiring, we can look at Google Street View
Not only can you see what streets around the world look like – this includes, buildings, cars, even people and city scenes, but you can explore amazing historical and cultural sites without leaving the classroom.
This part gets a little bit away from traditional maps, but it gets into social, cultural, political and physcial geography that would opens up endless avenues for student relevancy and interest.
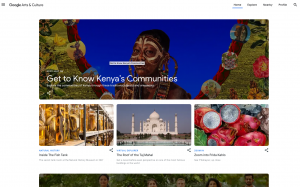
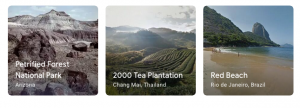
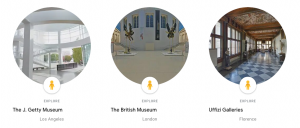
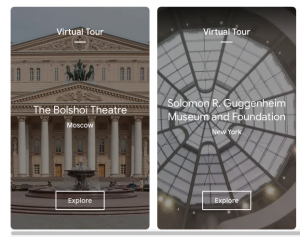
The Google Cultural Institute is like a virtual museum. This site lets you explore museums, architectural significant buildings, natural wonders, or even the roof of the paris opera house. In museums you can basically walk through as if you were there, seeing art and artifacts. In another section you can zoom in on art work. The cultural institute is where you can also see historical documents and deep dives into different topics. It’s almost overwhelming the amount of information they have there and I really recommend checking it out
In researching for our Google Maps in Education project, I was looking at the workshops available at the Digital Scholarship Commons. They have a data visualization and mapping workshop this week but I don’t think I can fit it into my schedule. The content is pretty interesting though, and I saw a few things that were new to me when I looked through the agenda.
This is a cool tool for making web maps that you can add content to tell various stories. These could be personal trips, the sequence of historical events, making a map of your community. It’s a tidy and easy to use format that I could see students really enjoying. It’s not too disimilar from Google My Maps, but has some extra style and prettiness built in to the functionality. It’s being used in journalism (like in this article about the spread of the Islamic State from the Washington Post) which would be awesome for students to feel that they are using a professional product.
There would be some FIPPA concerns I’m sure, but maybe a class account could be created, and all content could be educational rather than personal. Or permission would have to be granted.
I could make a StoryMap to show which countries all the food I’ve made for my free inquiry have come from!
Timeline JS is used for making web-based timelines showing events over time. We’ve all seen timelines like this and would be a cool idea to make timelines with students. I remember making timelines on paper in school and I’ve seen them on our Wednesday link2practice as well.
Just like StoryMap JS, Timeline JS is being used on by professional writers and journalists, like here, in an article about Nelson Mandela’s life.
After seeing this I’m considering using Timeline JS to create something for my final project for our seminar class. We are supposed to document our progress for one of the Teacher Education Program Competencies and I think it would be kind of cool to make a timeline of what I’ve learned this term.
For our group inquiry project we are looking at how Google mapping products can be used in the classroom to increase relevancy and interest for learning.
I personally believe there are almost limitless ways that maps can be included in the classroom, either paper maps or digital. The mapping and GIS technology that is available today can help students look at their communities and world in amazing ways. Talk about connection to place!
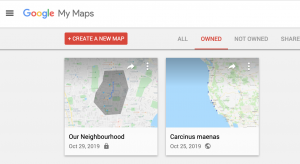
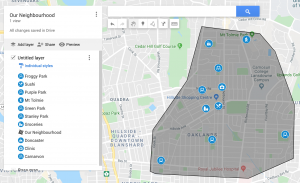
Google has a lot of really cool mapping (and exploration) tools that education environments can take advantage of. What I’m most interested in is how students can make maps themselves. One of the easiest ways to do this is with My Maps. This different from Google Maps which is more for looking up information. In My Maps, you can:
Add Points, lines, shapes
Attach photos, videos, links
Calculate routes, perimeters, areas
Place markers along a route
Save and share the map to collaborate
Use different base maps
Change the icon images
Save different information in different layers
Icons can be coloured based on numerical data – colours will then show information
You could use maps like this in the classroom to describe points of interest in the neighbourhood, province or world. Students could add photos or videos, even audio of their voices talking about the locations. They can delineate different areas, show them in various colours, and calculate their areas and perimeters. The measurement tool can be used to measure distances without adding shapes or lines to the map. You can plot routes for car, walking, public transport or bike.
Students could create a tourism map for a location they have studied in class. They could delineate where different languages are spoken throughout the world, and give examples for different words. They could plan a real or imaginary trip, calculate the distances, travel time and mileage. They could map the locations from novels and other fiction. Or map information about their class – house locations, birth places, locations people have visited, free wifi locations, make field trips maps – for parents ahead of time, or to reflect on a trip after the fact. The additional information they add for points along the way in any of these scenario has a lot of value.
Information can be separated into different layers – e.g. historical events can be separated by time periods, or species information can be saved separately. You can print maps from here, or export to PDF.
In terms of simple map making, My Maps has a lot of functionality that could be easily brought into the classroom. There is no software cost, and it is browser based so it’s accessible anywhere.
Here’s a tutorial from another teacher on how to make and annotate a map:

 Google has a lot of really cool mapping (and exploration) tools that education environments can take advantage of. What I’m most interested in is how students can make maps themselves. One of the easiest ways to do this is with
 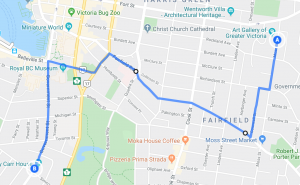 Add Points, lines, shapes
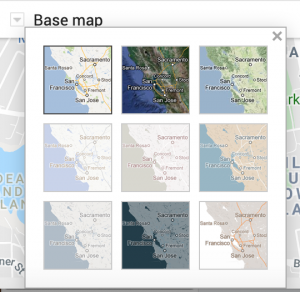
Recent Comments